 2005–2006
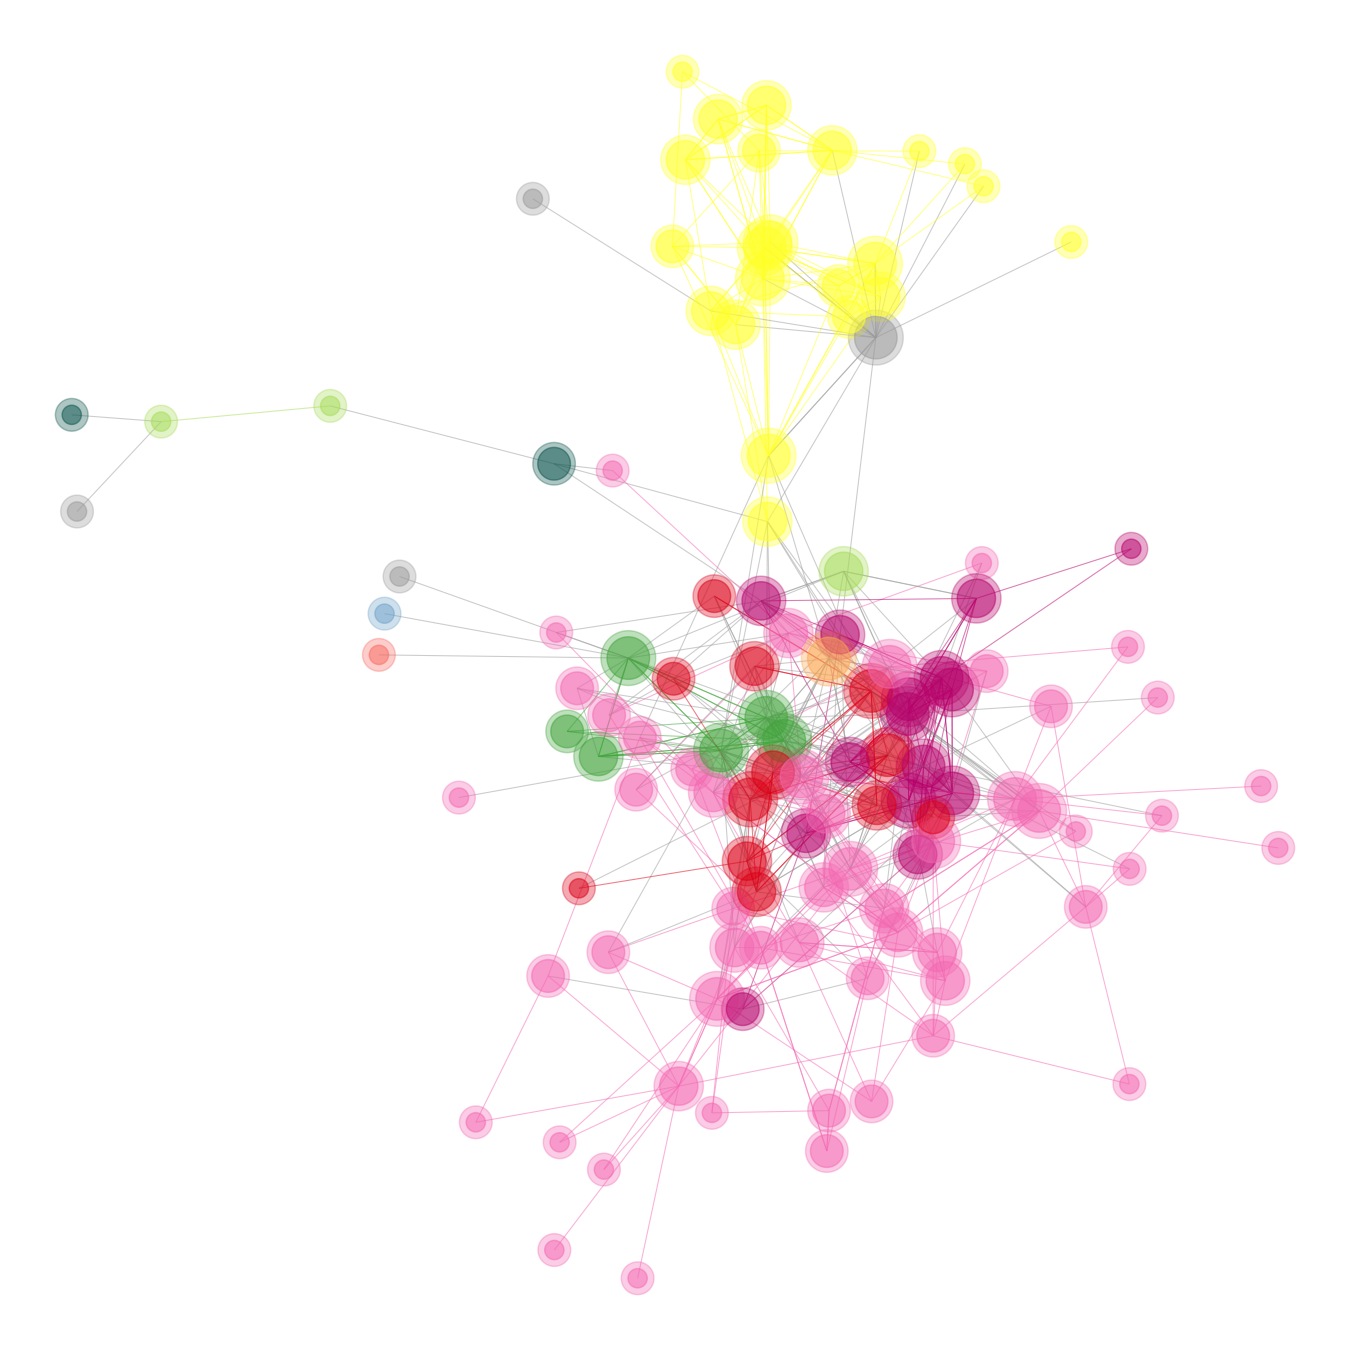 2007–2010
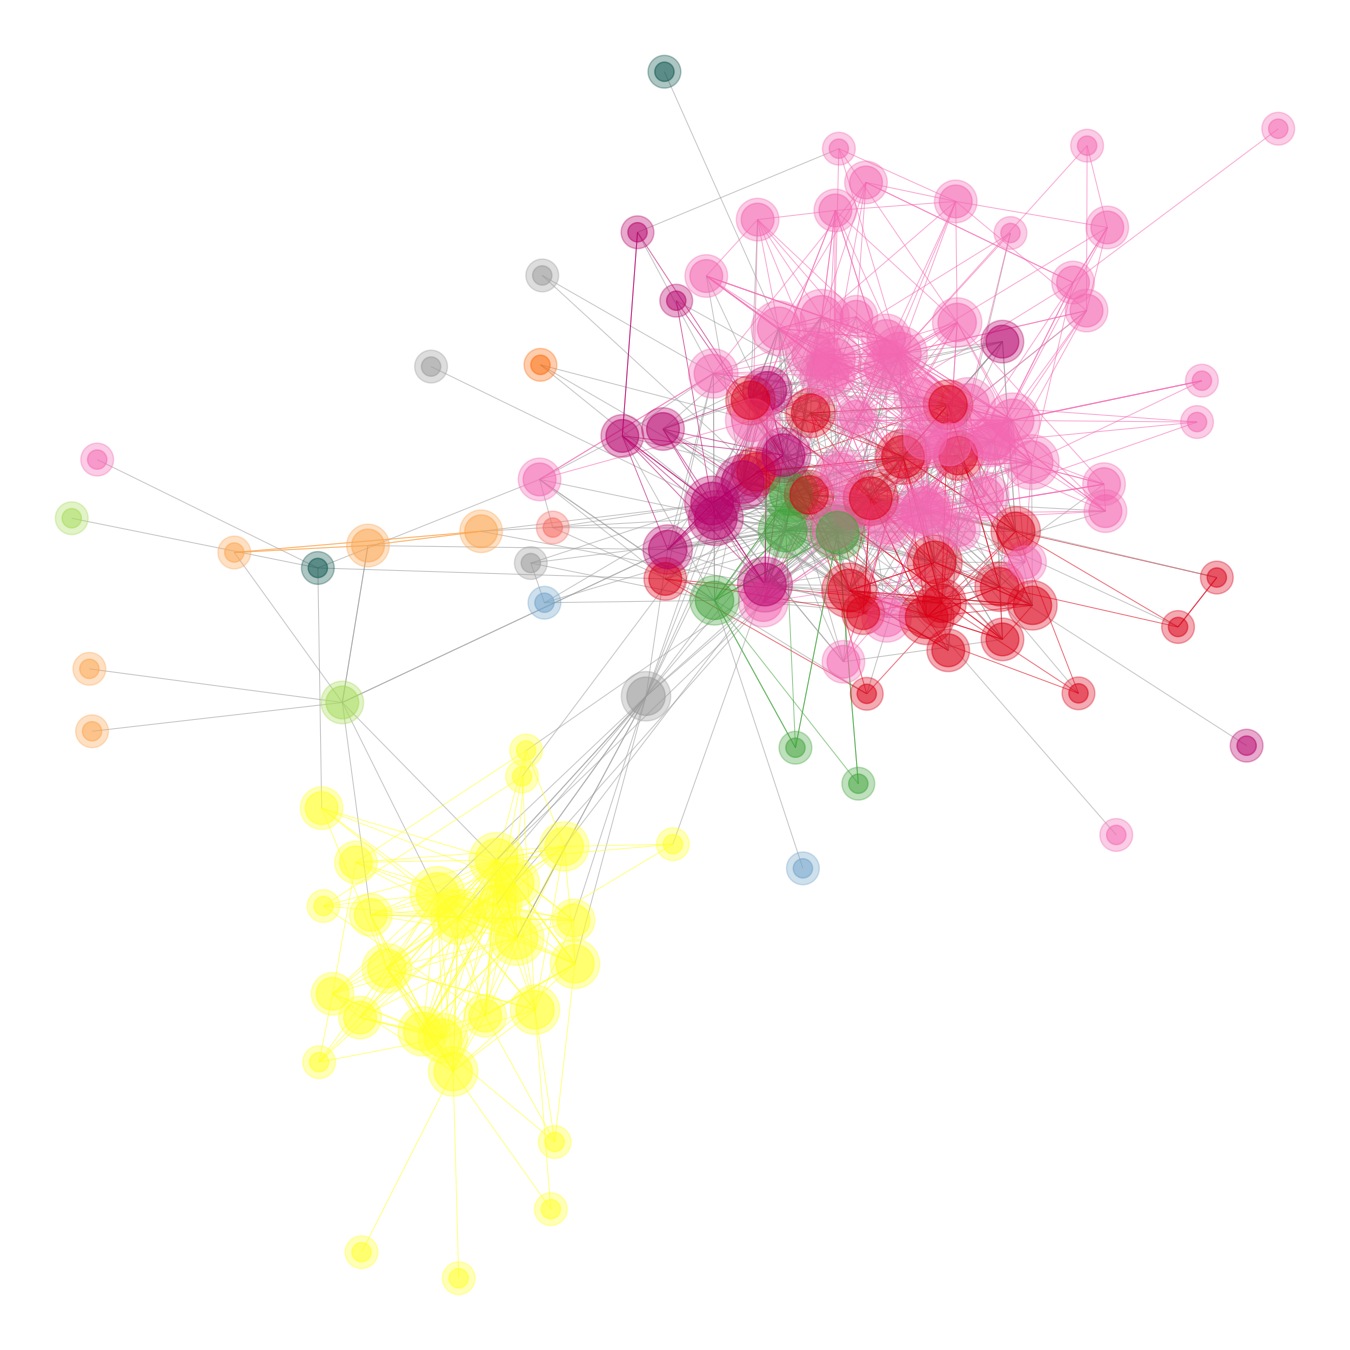 2011–2014
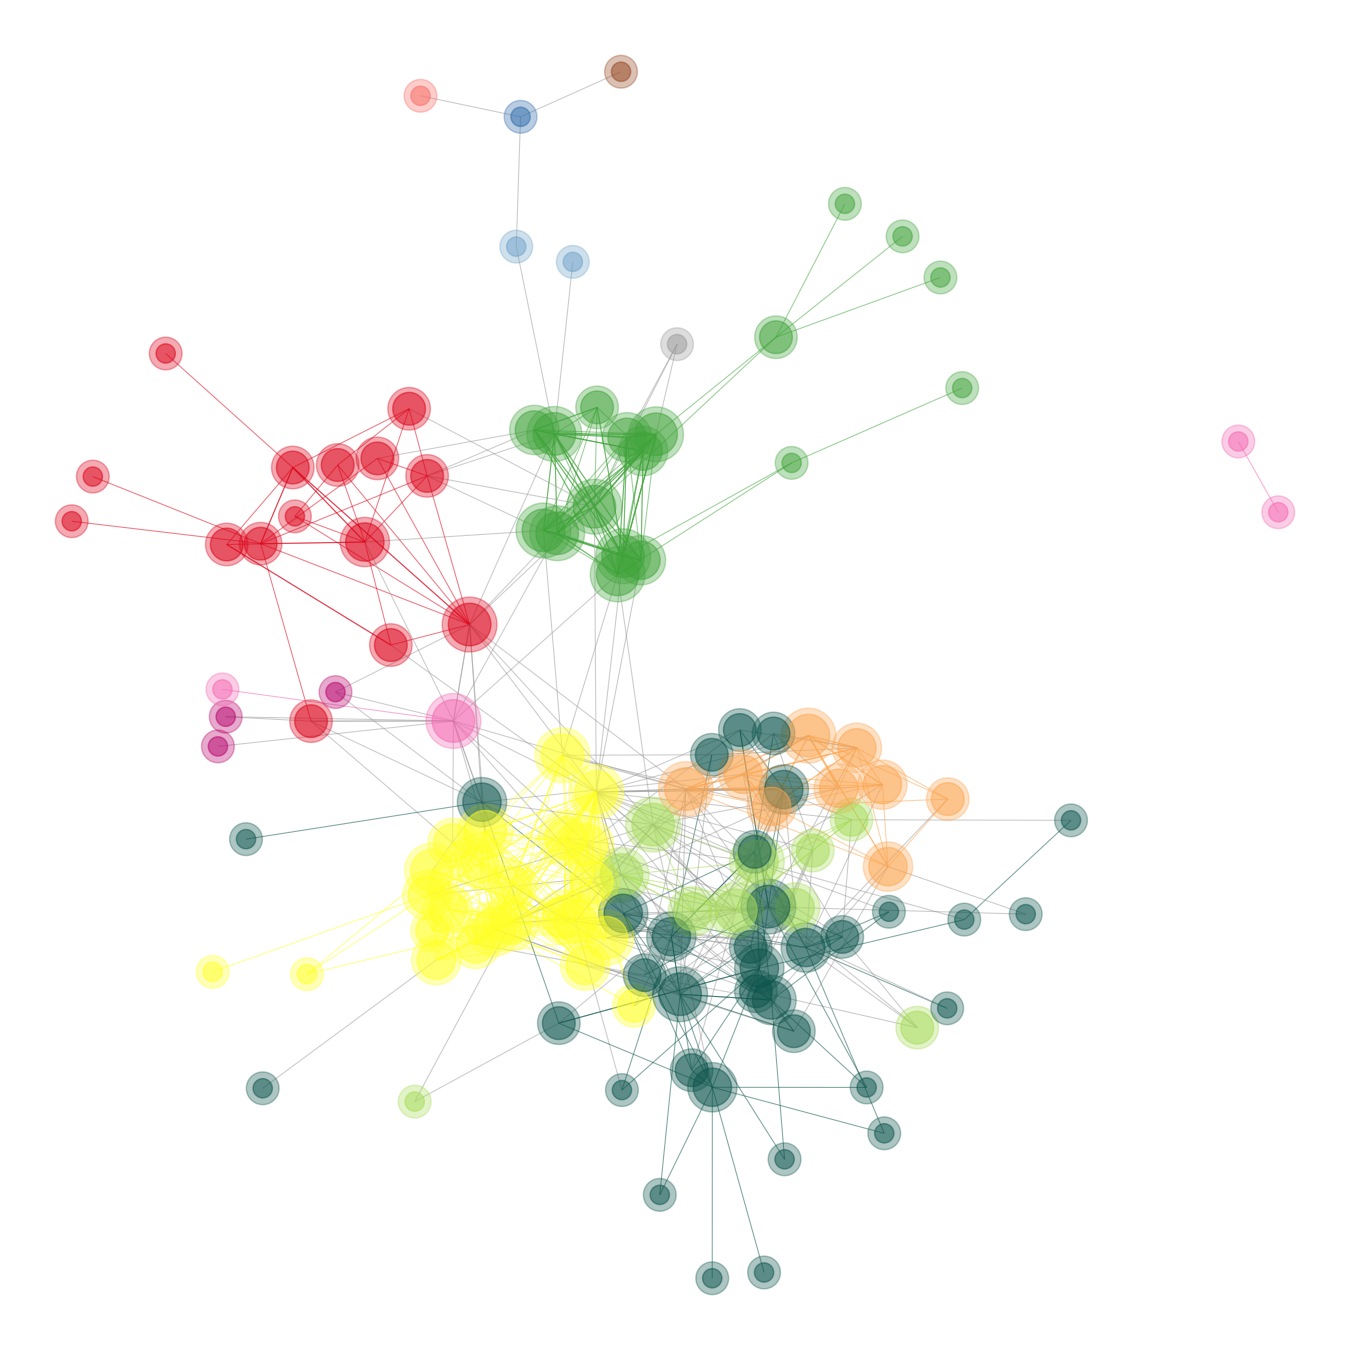 2015–
2015–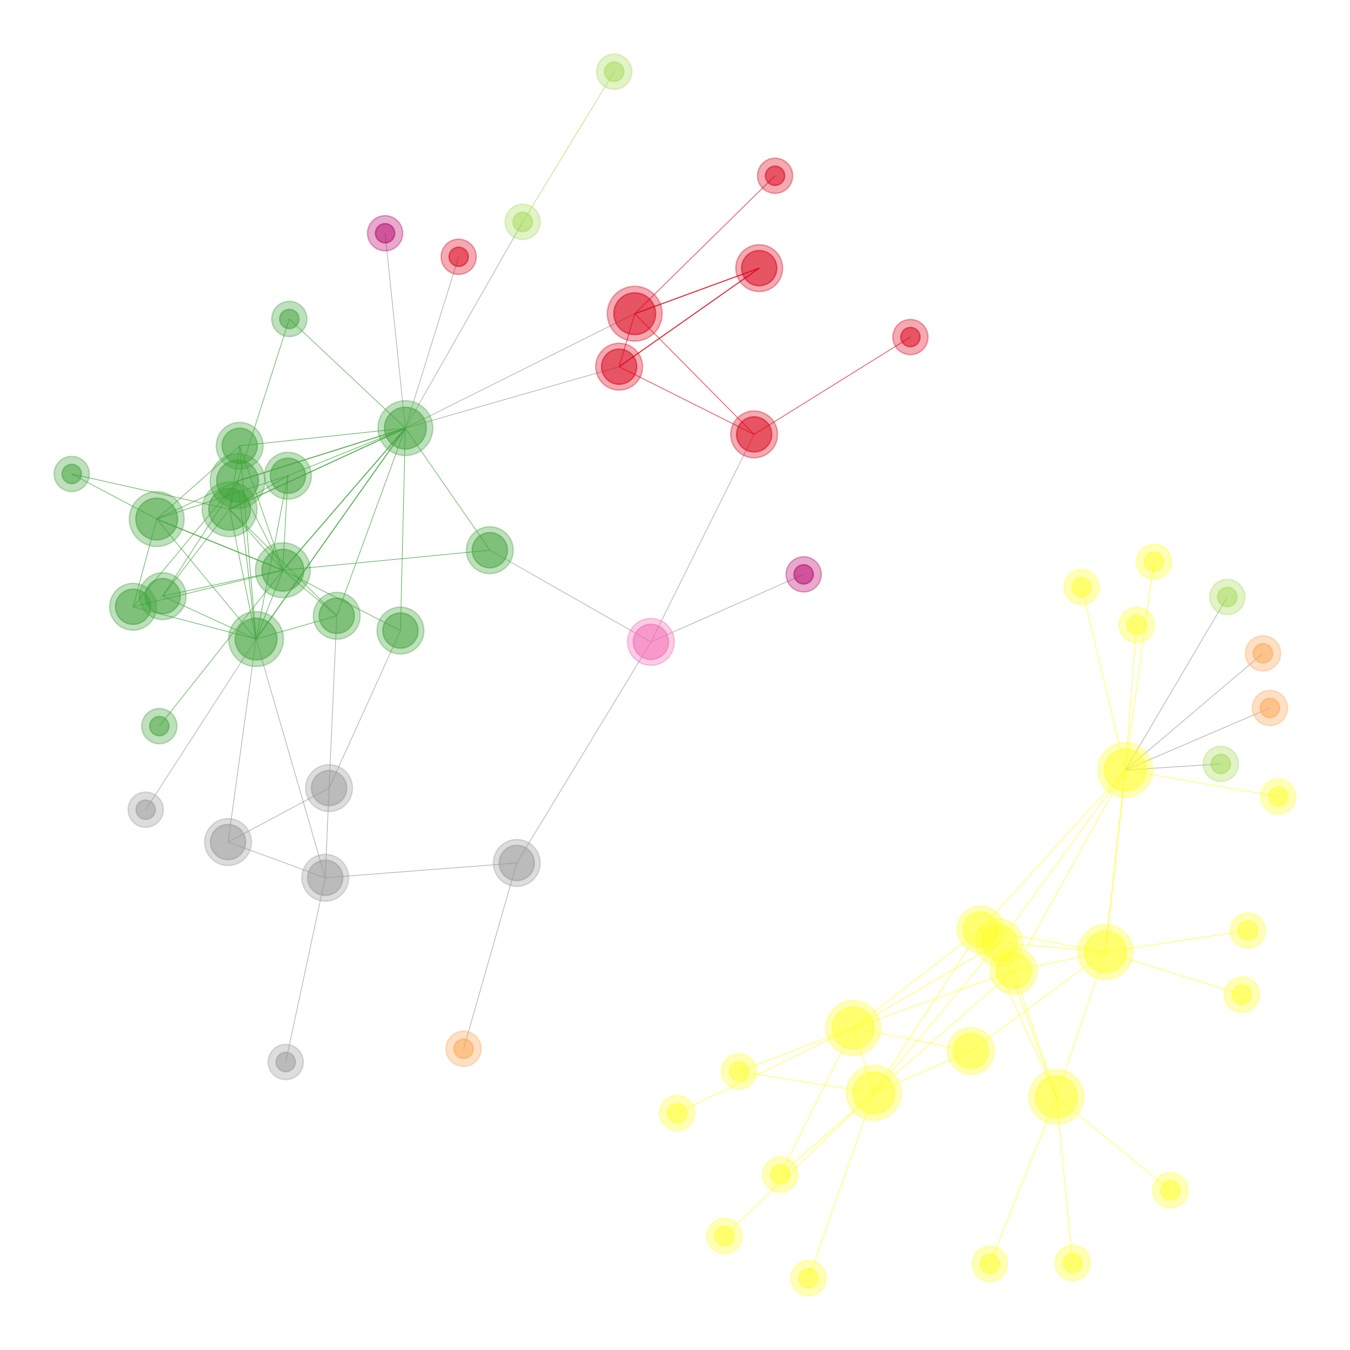
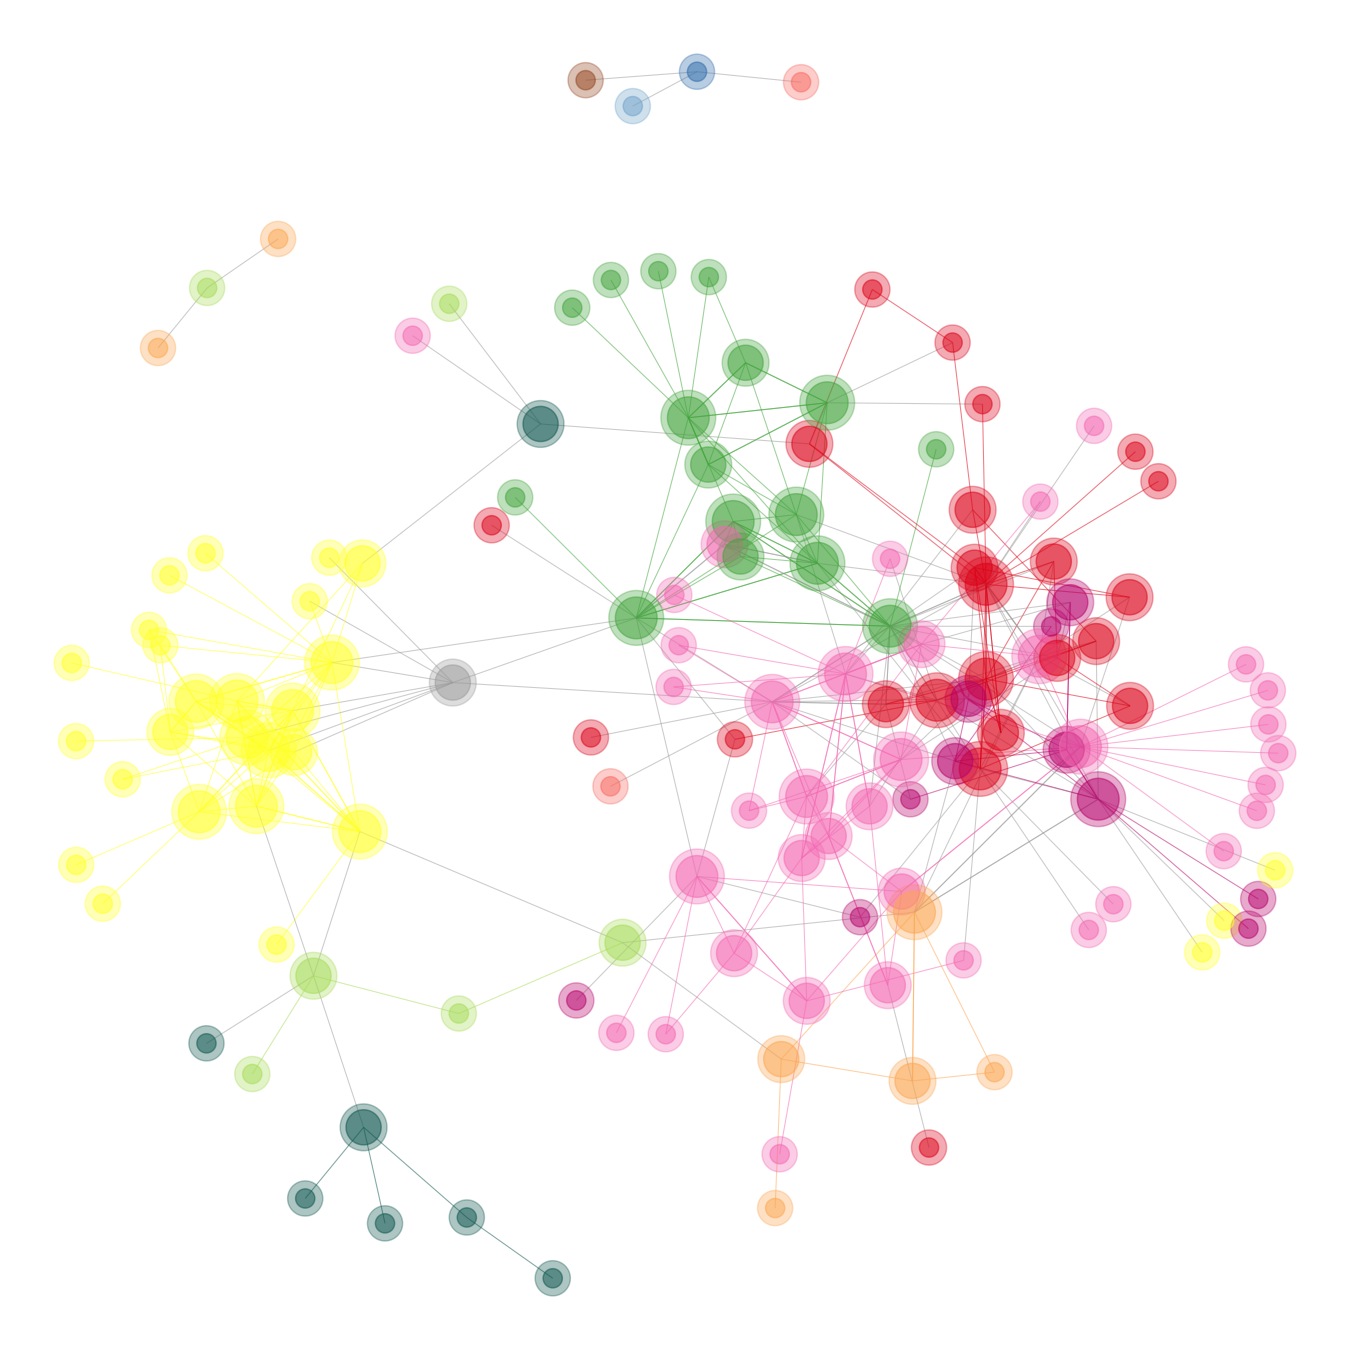
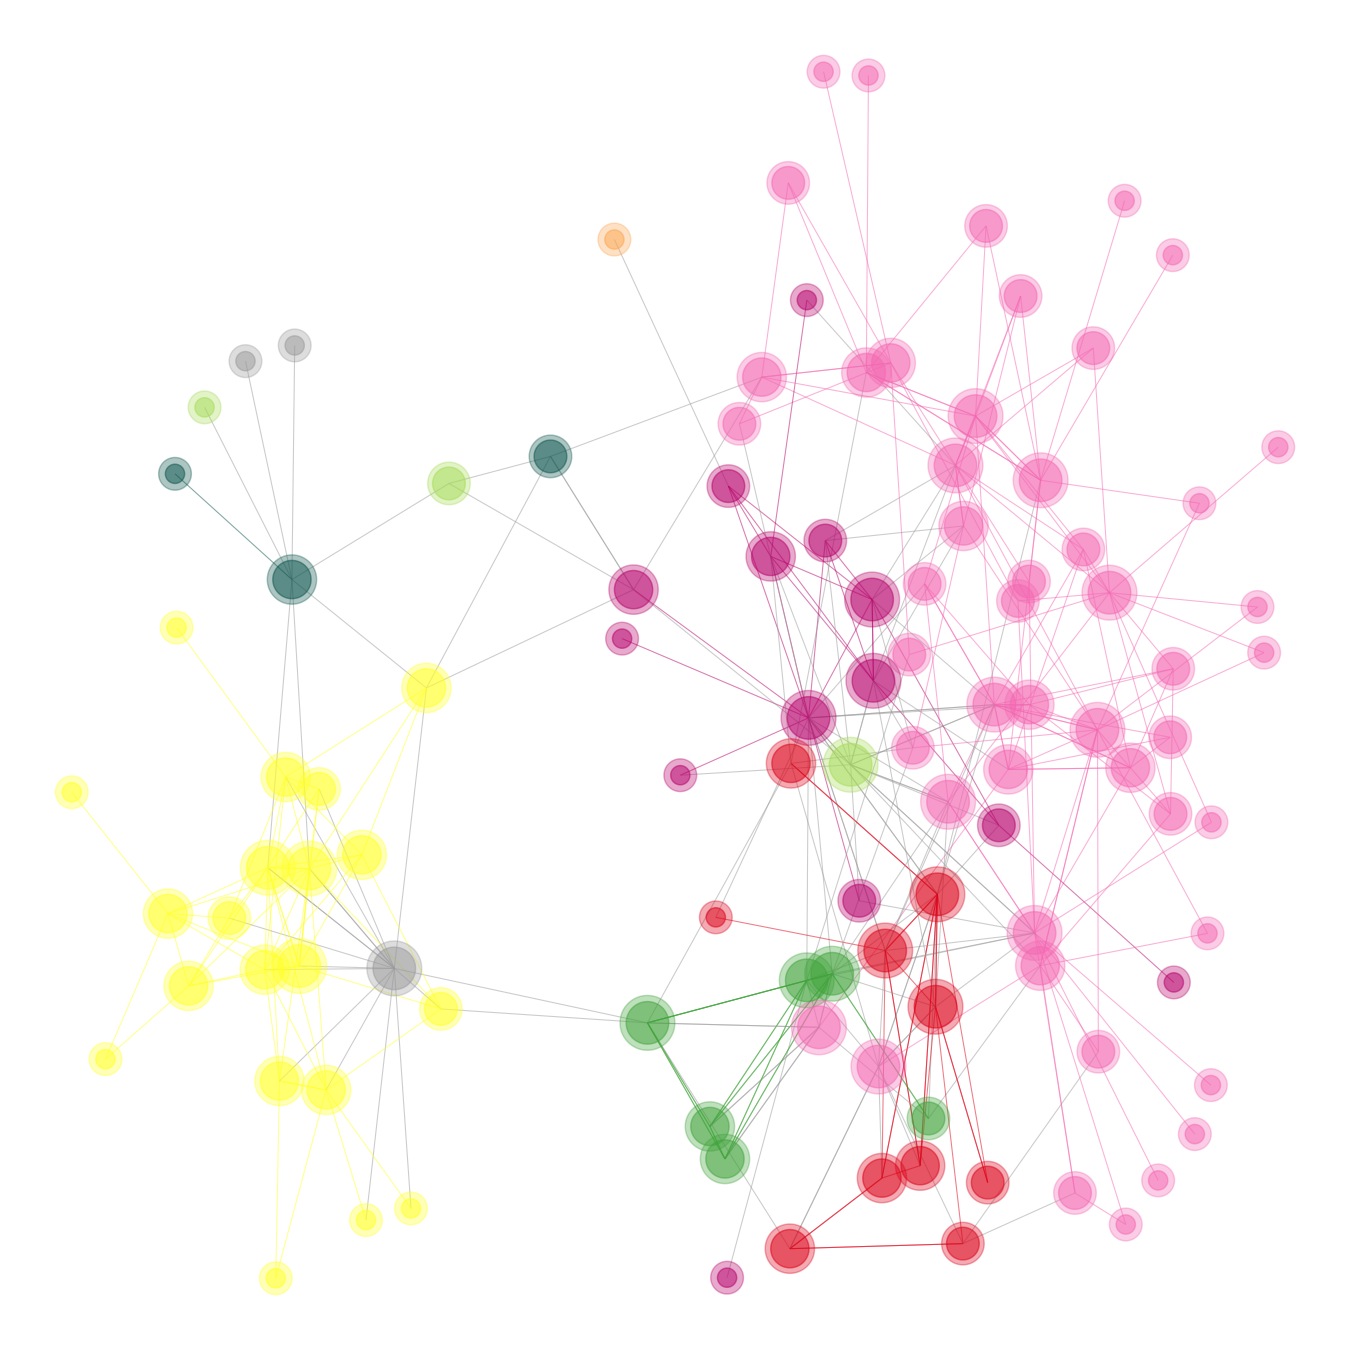
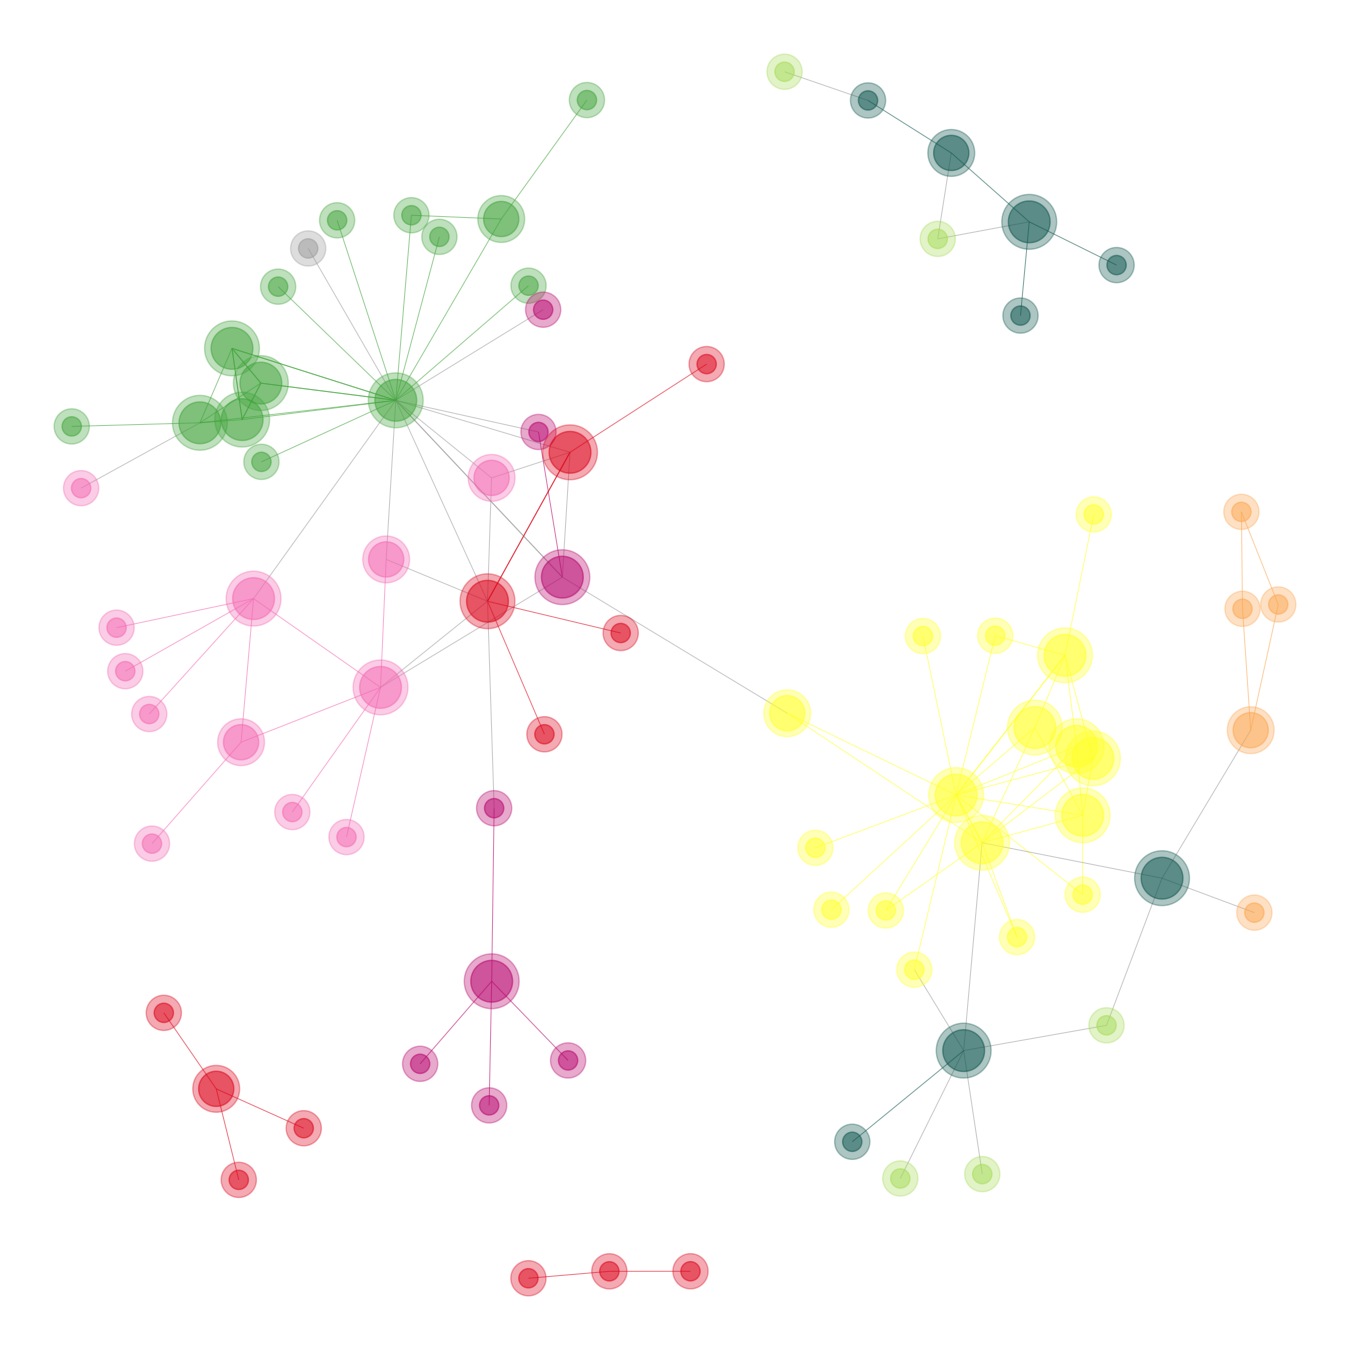
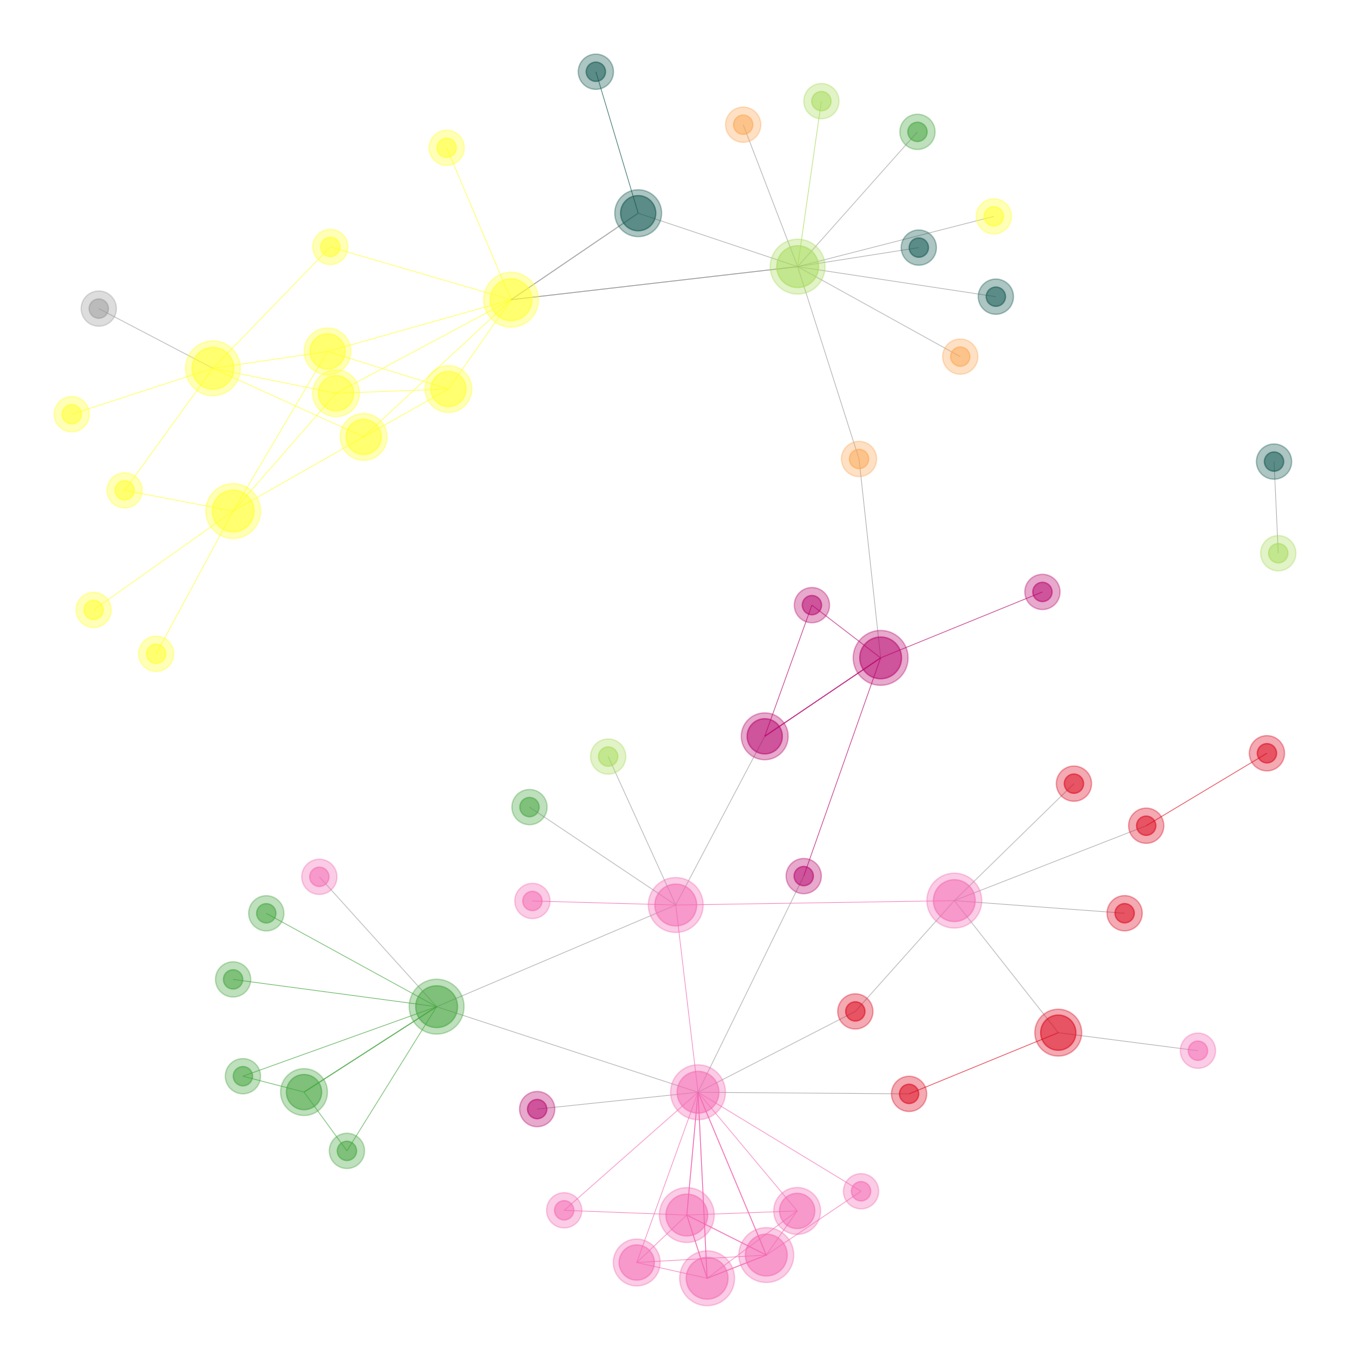
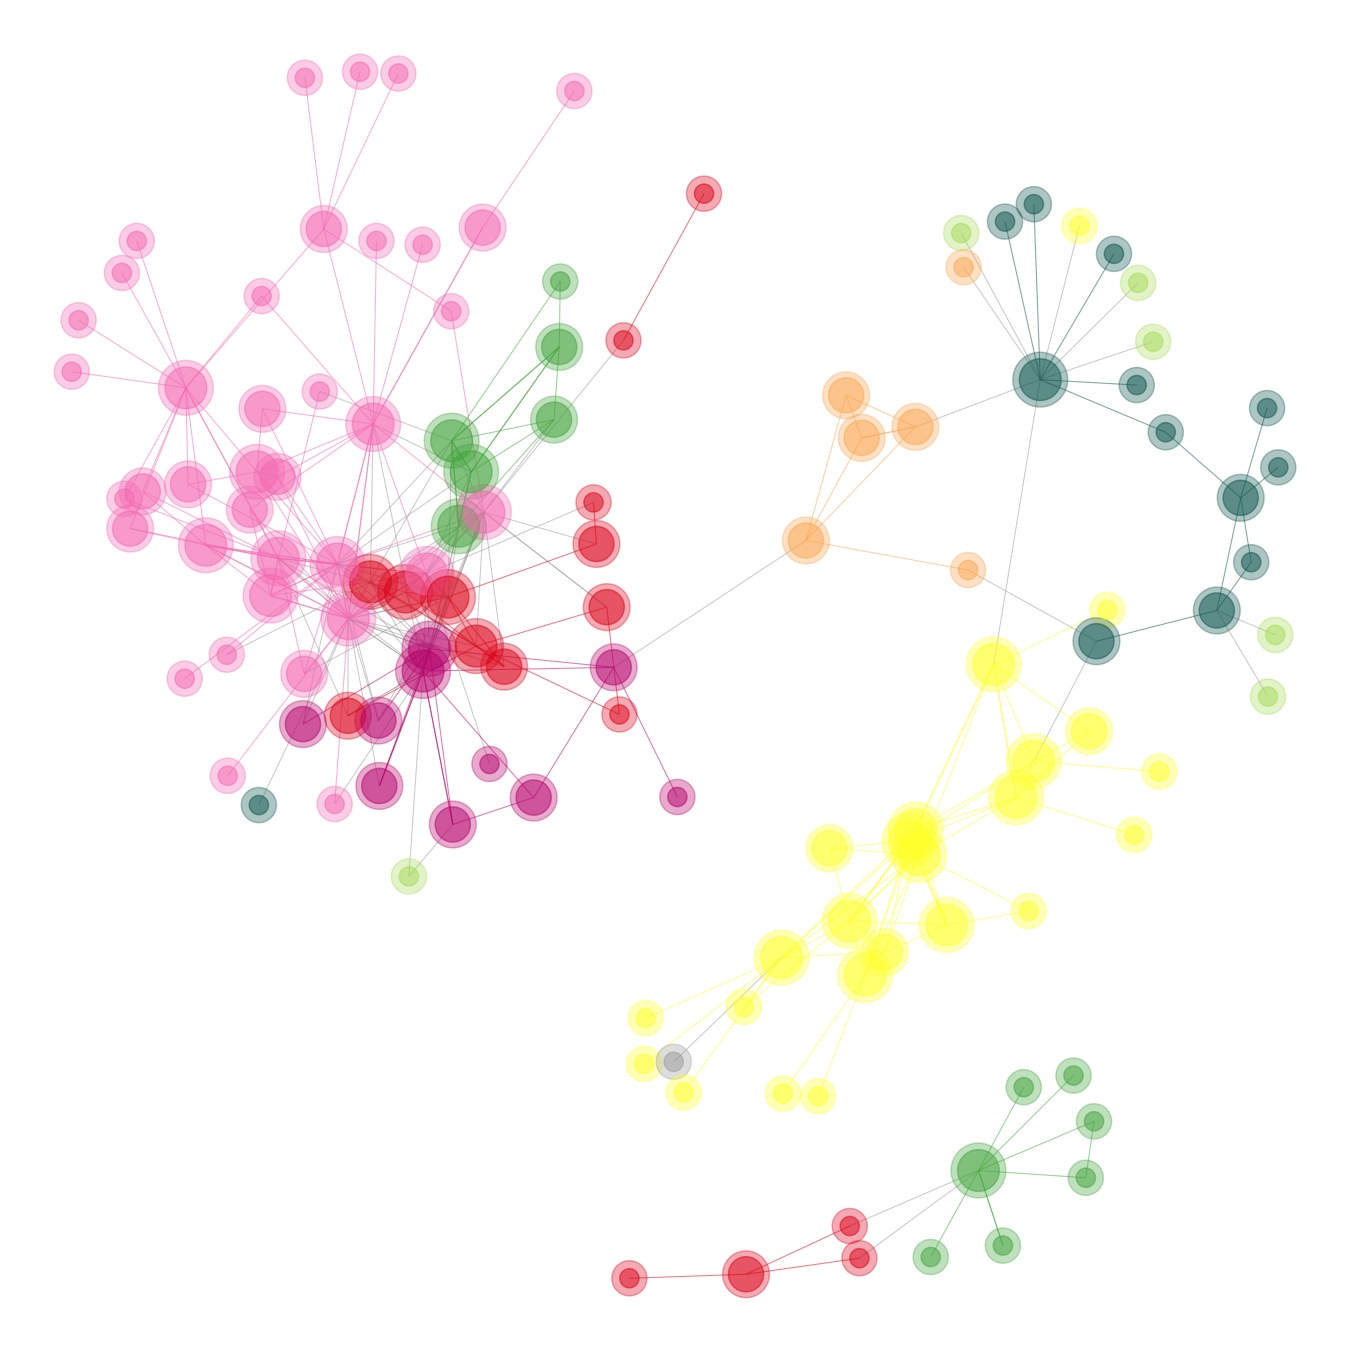
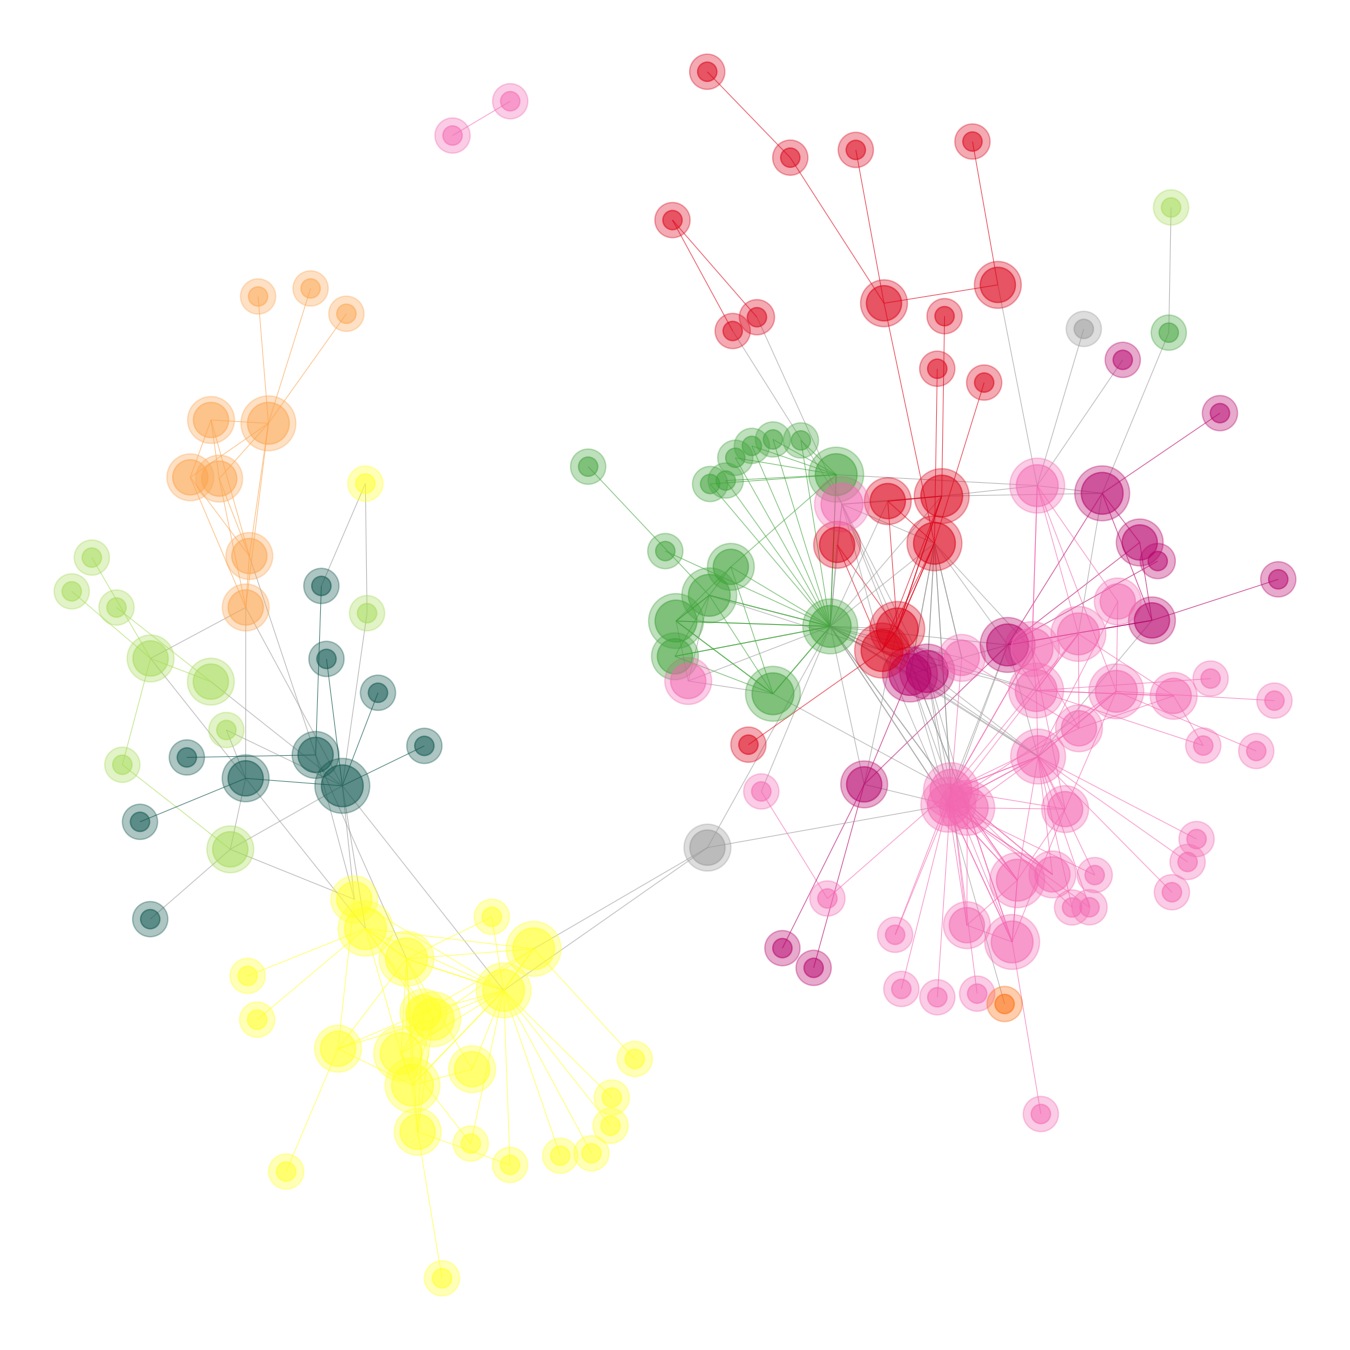
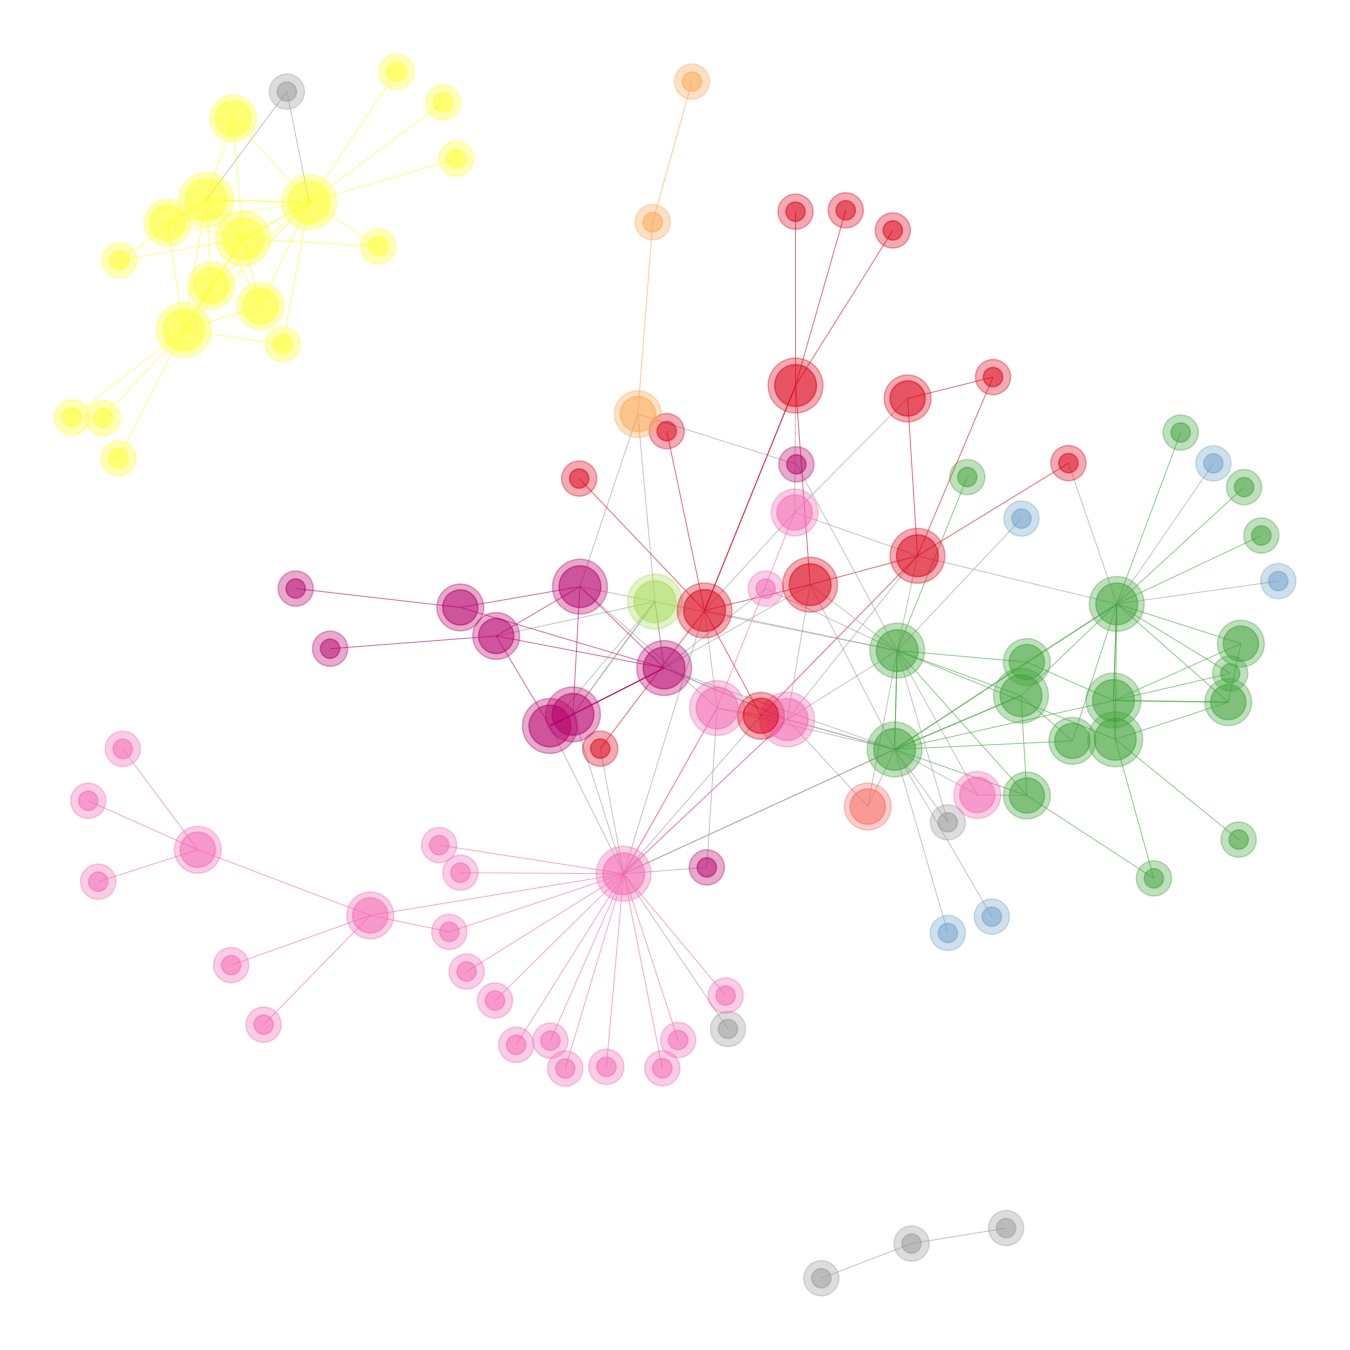
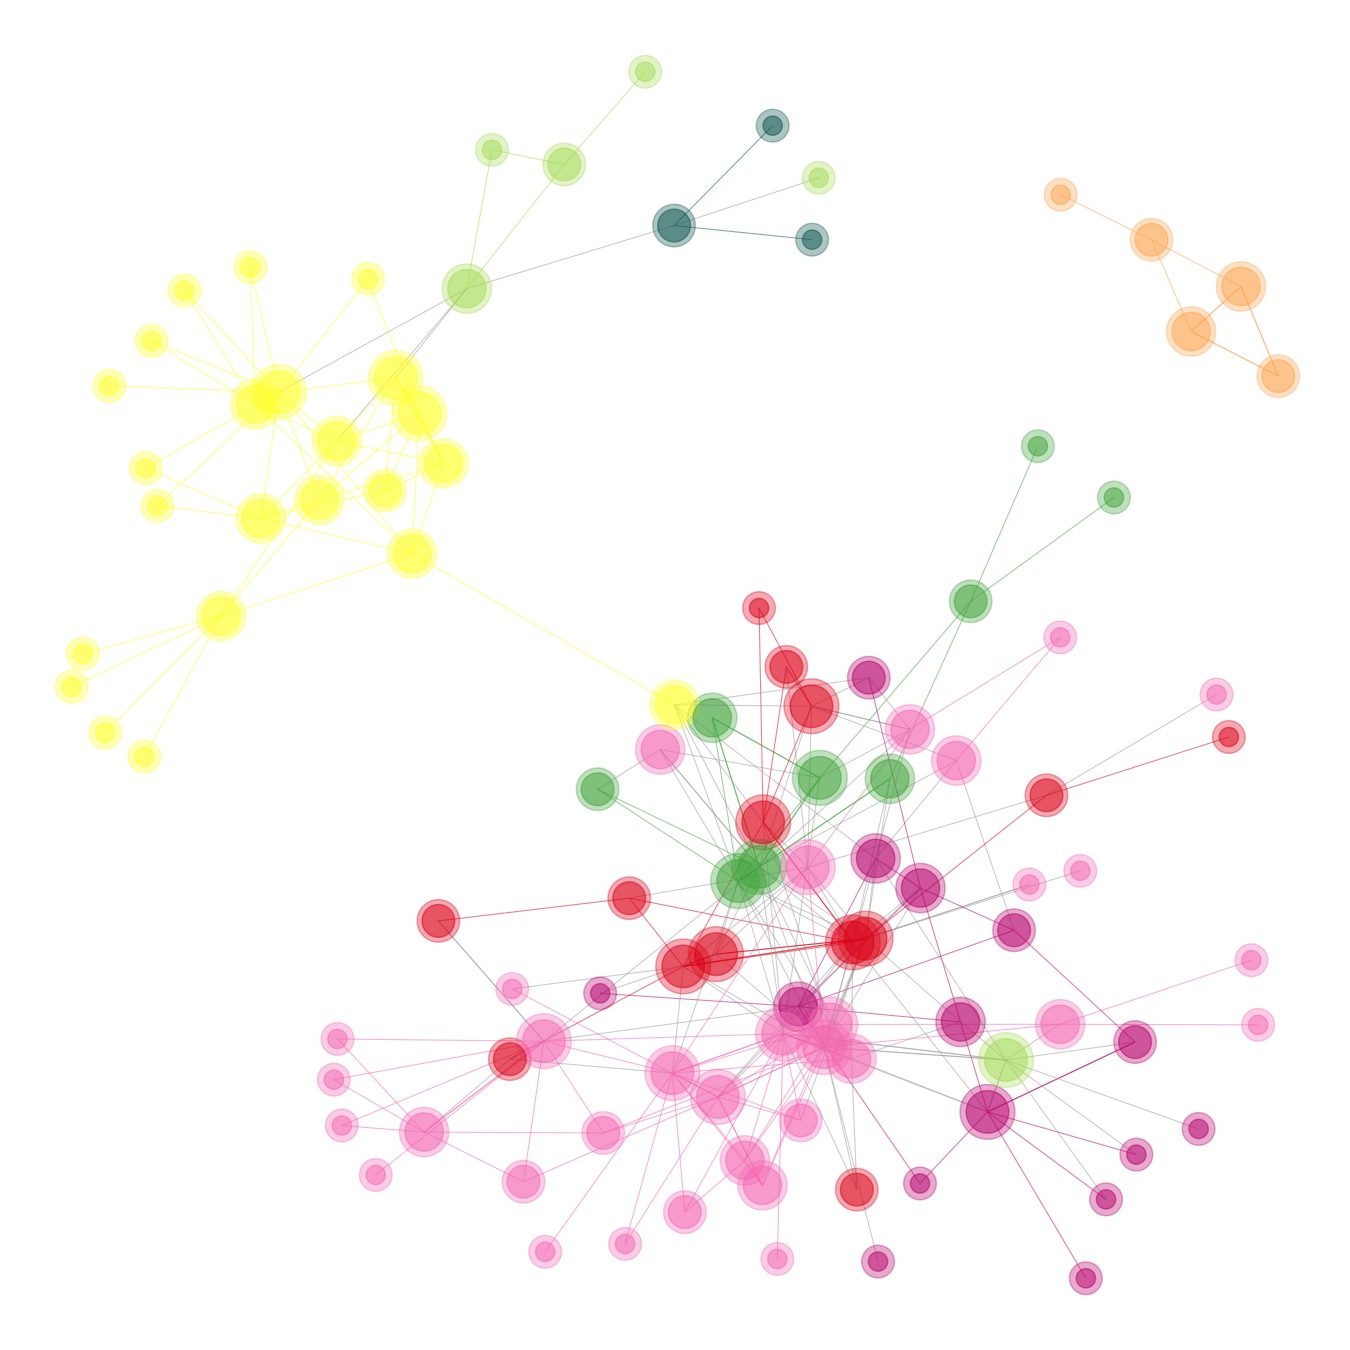
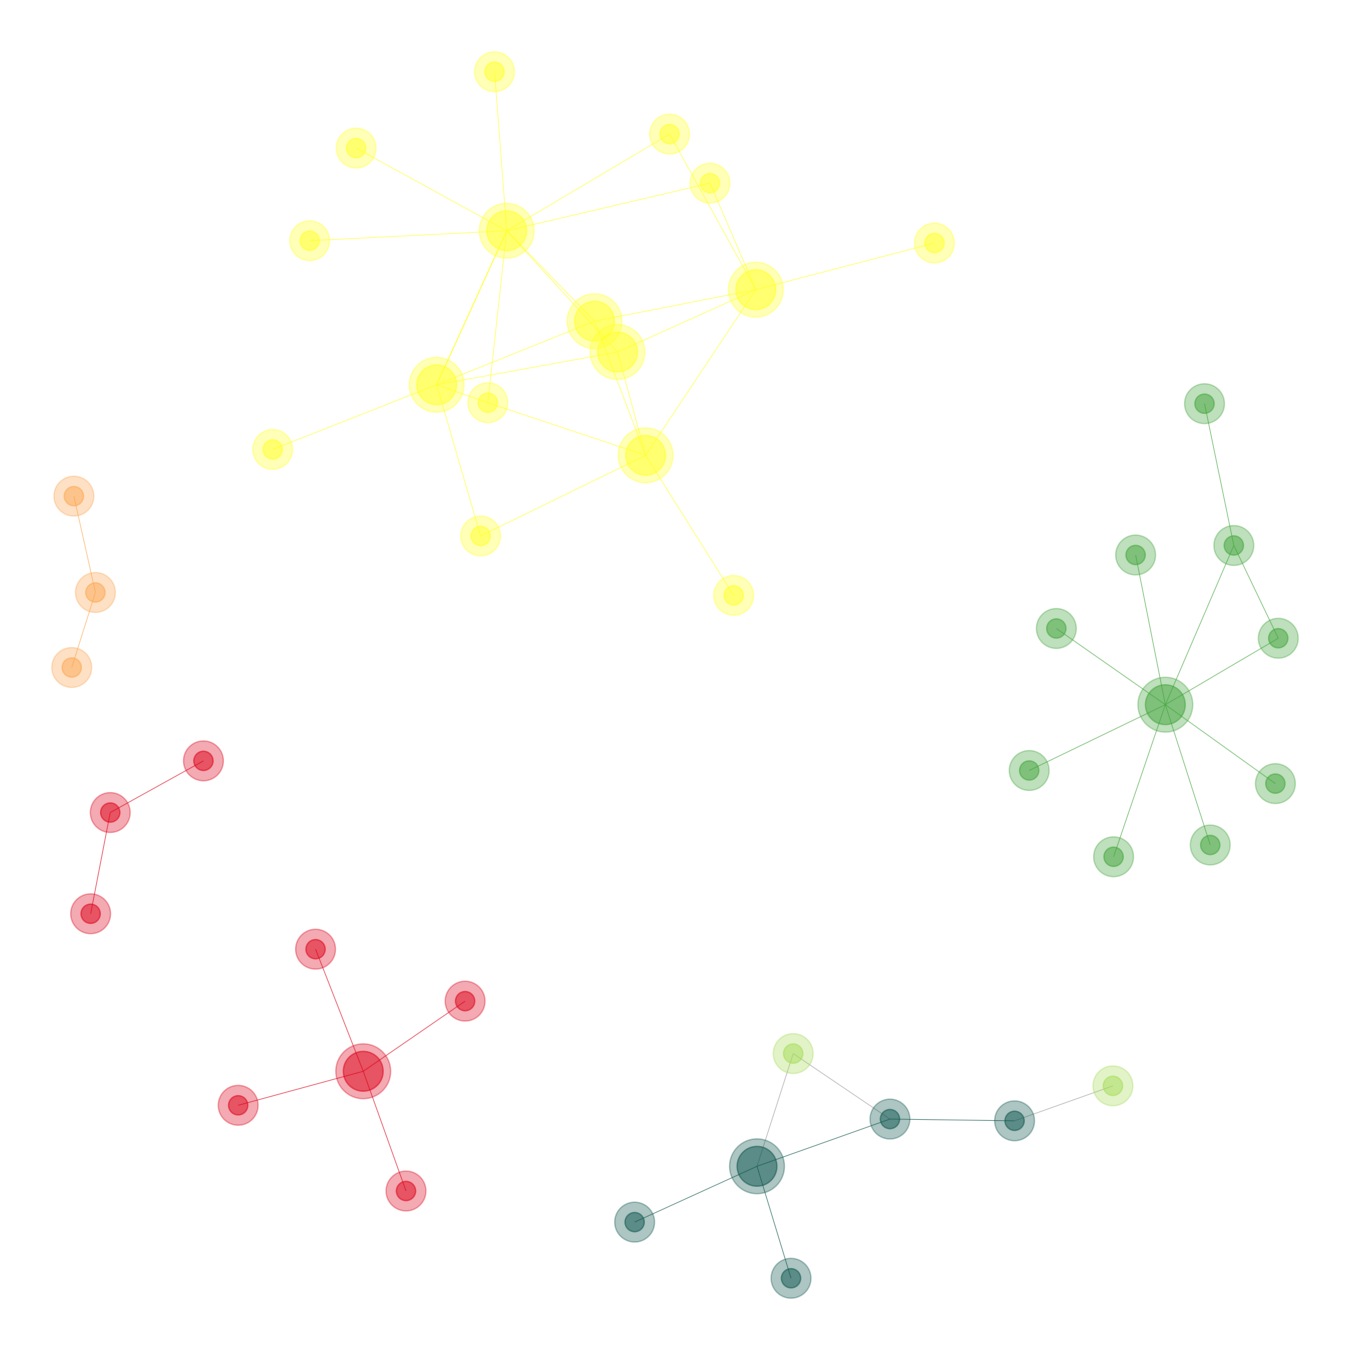
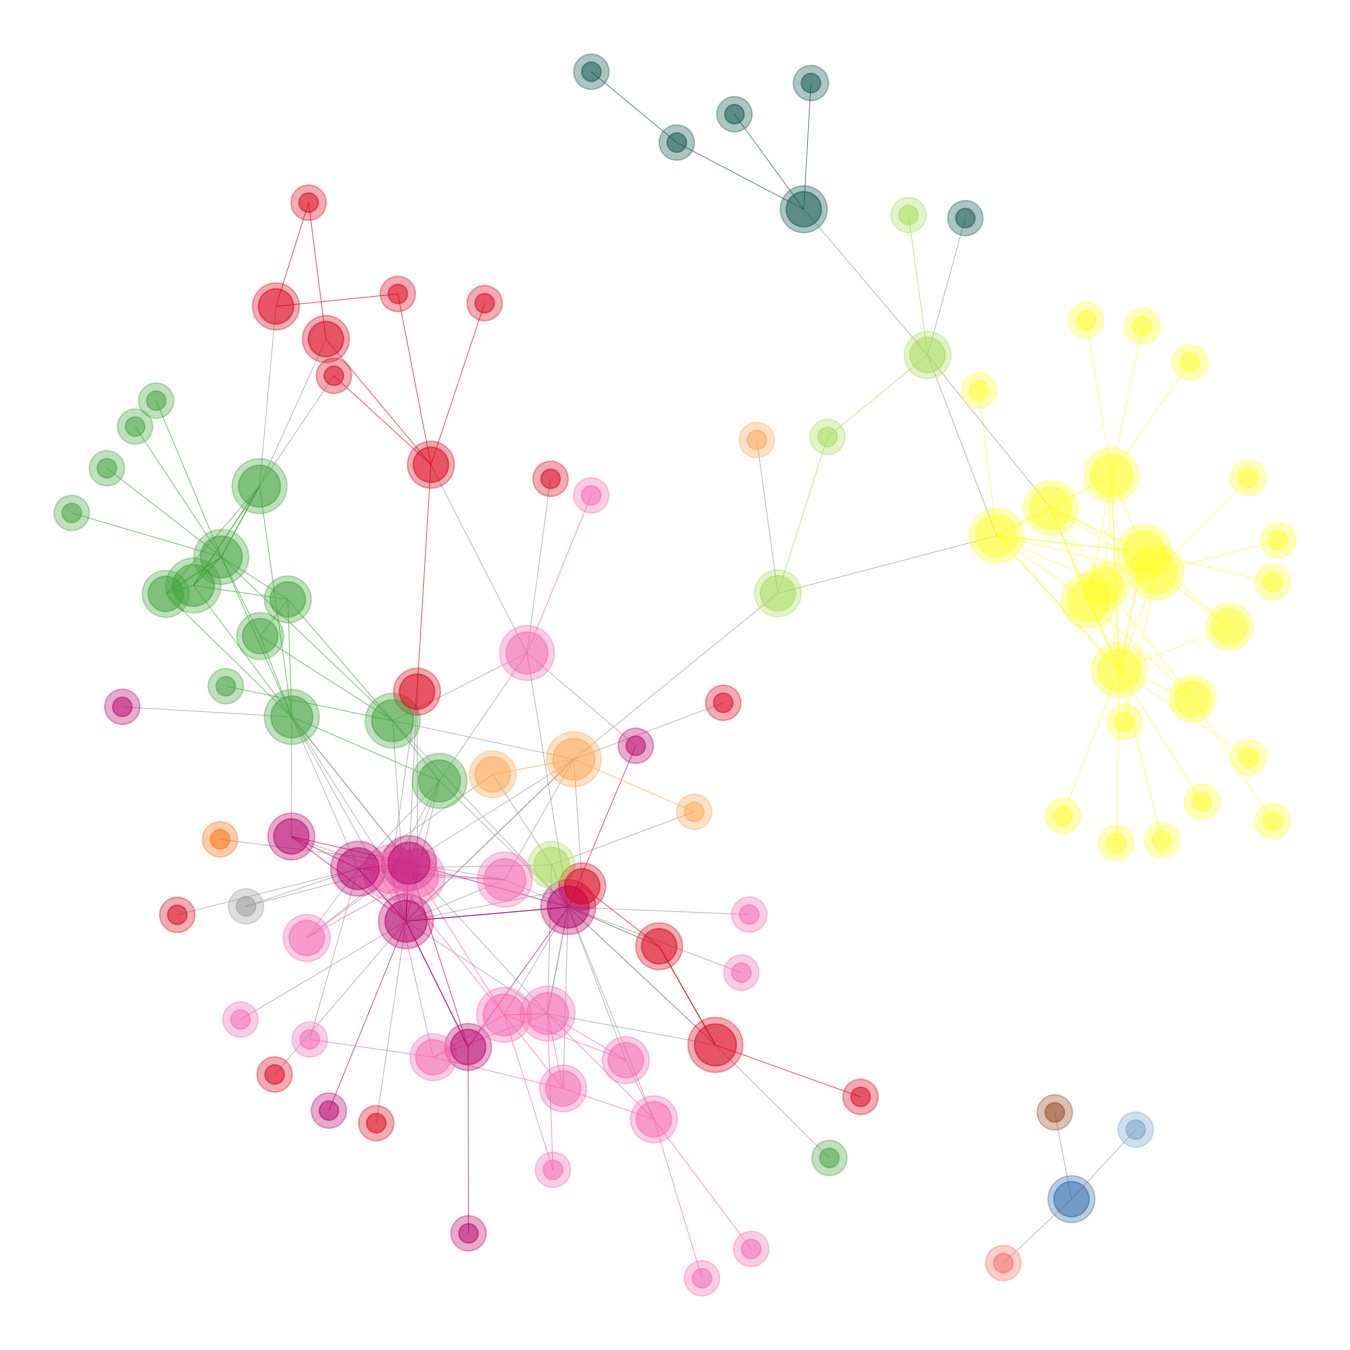
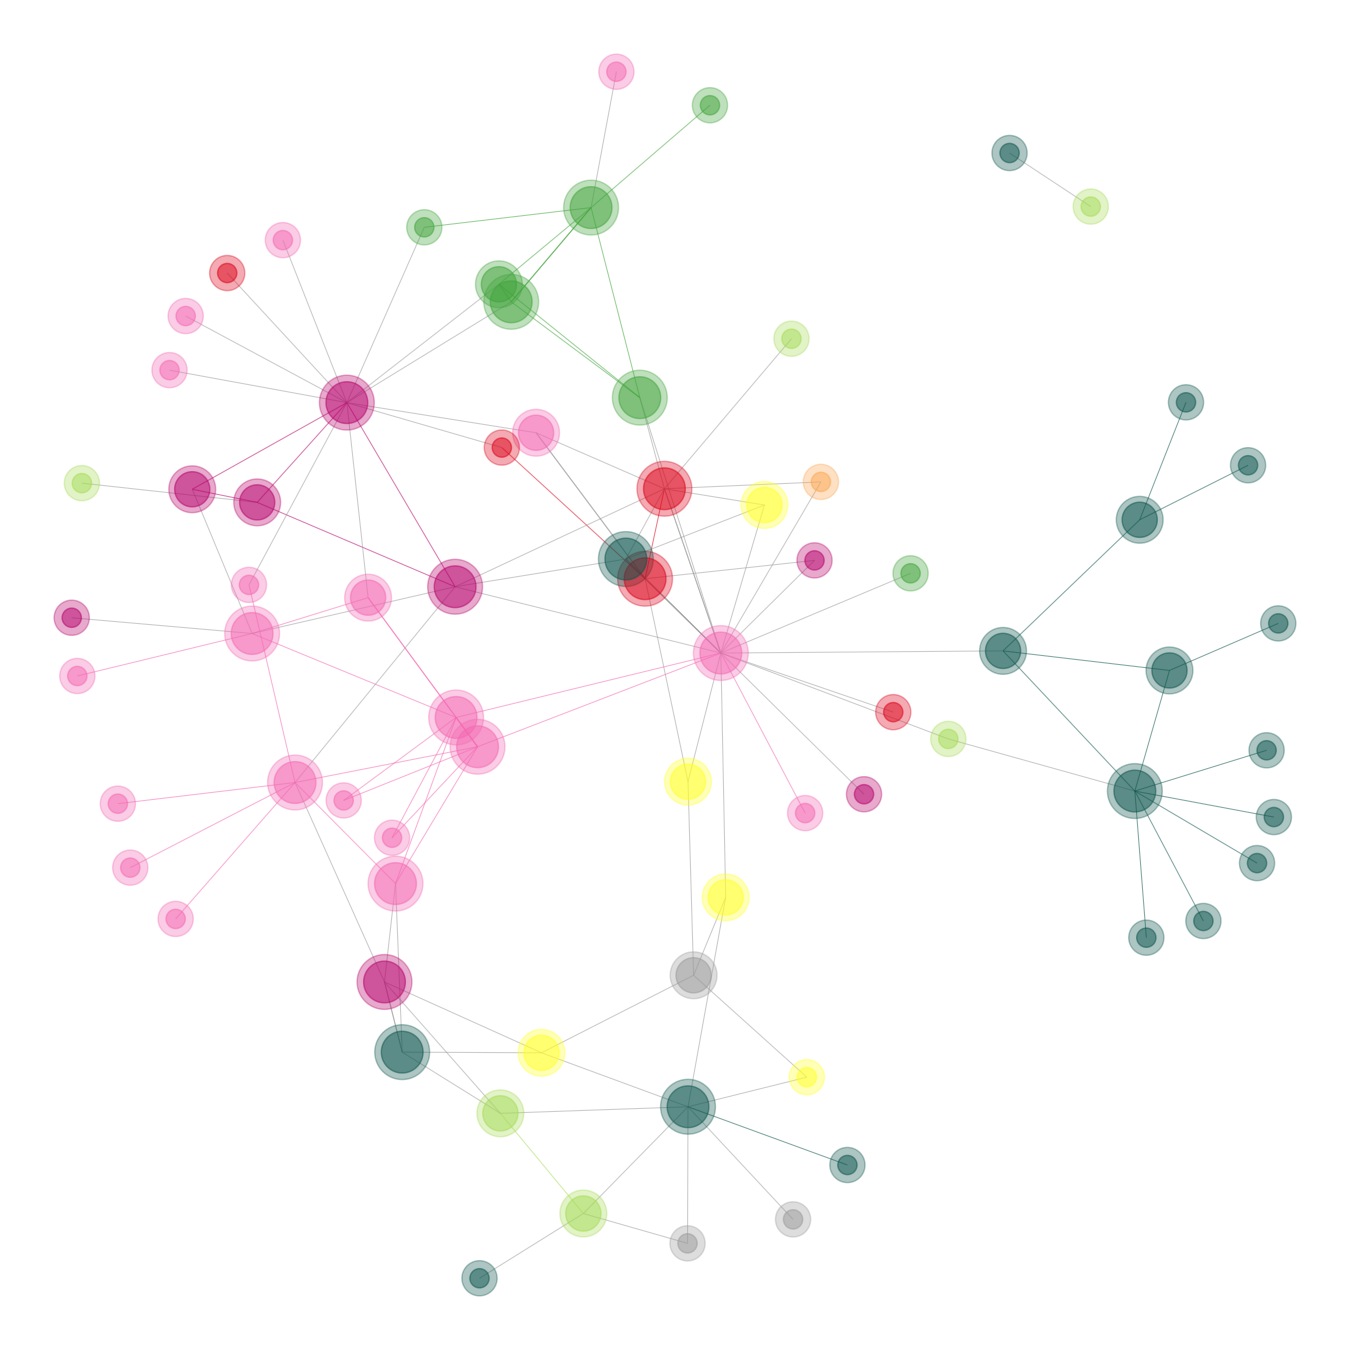
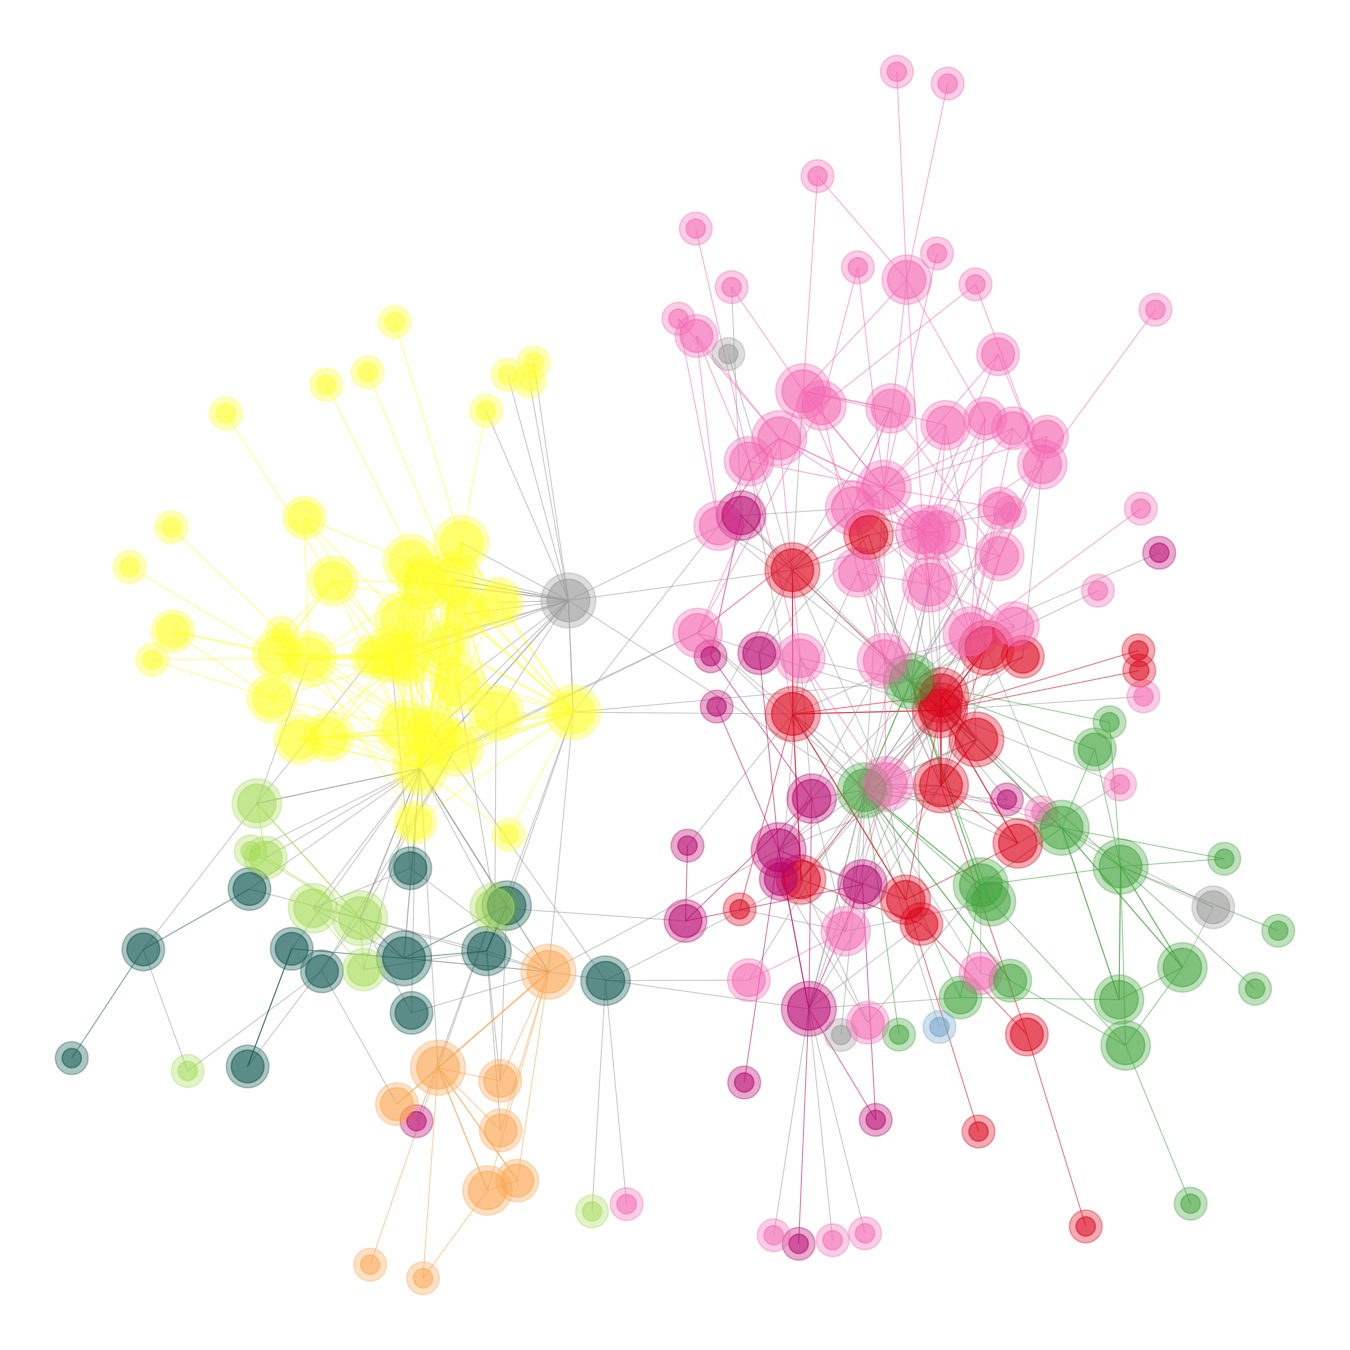
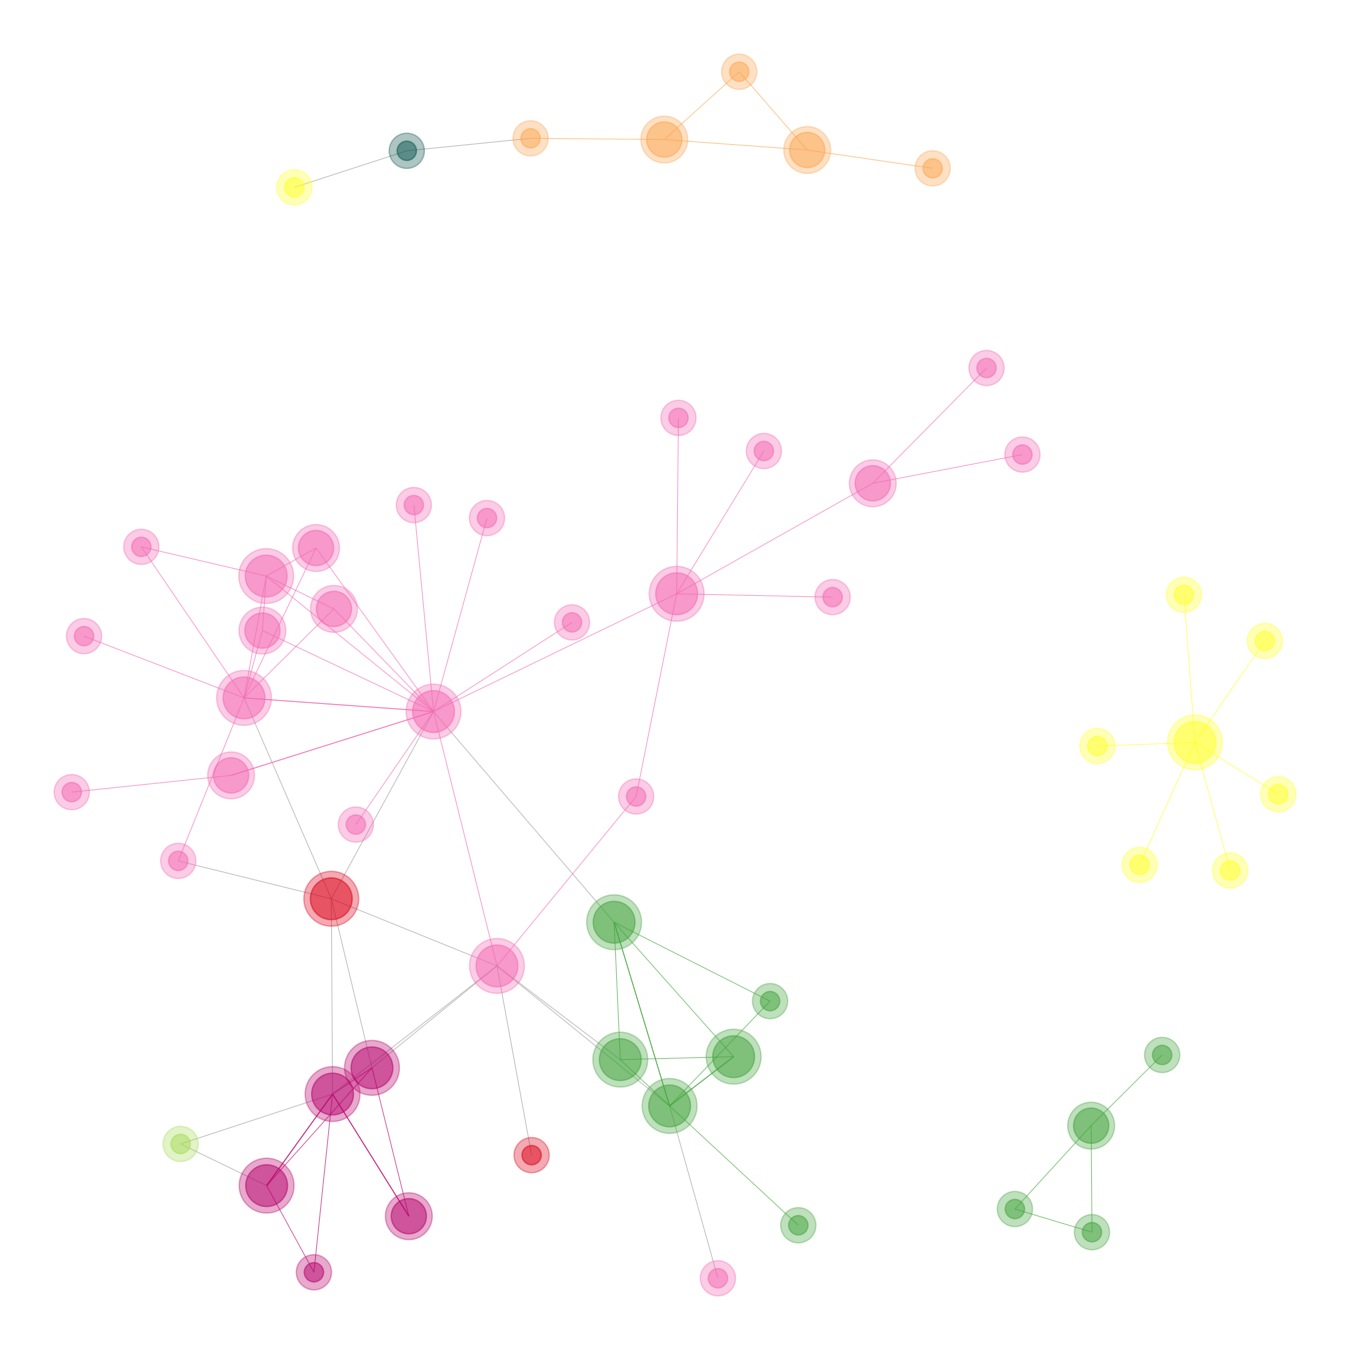
The data are split either thematically (by ministerial area) or by legislature (nationwide elections).
All networks are directed graphs drawn with the Fruchterman-Reingold force-directed algorithm. The ties connect the first author of each bill to the cosponsors of that bill. The nodes are sized by unweighted total degree. When two nodes belong to the same group, any existing tie between them is given the color of that group. There is a guide to party codes and colors at the end of this page.
See the interactive visualization, or view other countries.
2001–2004 (missing 2001–2003)
2005–2006
2007–2010
2011–2014
2015–
Agriculture
 Culture
 Economy
 Education
 Environment
 Foreign Affairs
 Health
 Housing
 Immigration
 Institutional
 Justice
 Technology
 Welfare